
Average dental assistant pay falls within the median of all healthcare assistant and entry-level healthcare roles. There can be quite a significant range in salary depending on where you live in the USA. Below we look at average earnings across all States, as well as employment figures and projections.
Jump to: Dental Assistant Programs
Average Dental Assistant Salary 2022/2023
| Average salary | $ 44,710 |
| Hourly wage | $ 21.50 |
| 90th Percentile of Earners | $ 59,200 |
| 10th Percentile of Earners | $ 31,450 |
According to the Bureau for Labor Studies (BLS) data released in April 2023, the average dental assistant salary in the USA is $44,710.
Dental Assistants in Minnesota earned the most of all States with an average (cost of living adjusted) salary of $58,890 – 24% above the national average. Dental Assistants in Louisiana earned the least at $36,180.
How much do Dental Assistants make an hour?
The mean hourly wage for Dental Assistants in the USA is $ 21.50.
Salary Range
Salary can range quite significantly depending on where you live and how much experience you have. There is a significant range in average earnings from a low of $19,580 in Logan, UT for an entry level position to a high of $78,860 in San Francisco-Oakland-Hayward, CA for experienced dental assistants. Dental assistants in San Francisco-Oakland-Hayward also earned the highest average salaries of all dental assistants in the USA at $62,830. See the tables below for more information.
Top paying States for Dental Assistants
Listed below are the top 5 states in which dental assistants earn the most – taking into consideration cost of living adjustments for each State.
- Minnesota – average annual pay of $58,890
- Washington DC – average annual pay of $52,820
- Delaware – average annual pay of $52,500
- Alaska – average annual pay of $52,430
- Massachusetts – average annual pay of $52,200
The bottom 5 states for dental assistants are as follows:
- Louisiana – average annual pay of $36,180
- Arkansas – average annual pay of $36,570
- Mississippi – average annual pay of $36,960
- Utah – average annual pay of $37,080
- West Virginia – average annual pay of $37,510
Salary & Employment Data by State
Browse the map below to find out how much do dental assistants get paid in your state and employment numbers;
| State | Average Salary | Above/Below Average | Hourly Wage | #'s Employed |
|---|---|---|---|---|
| Alabama | $37,720 | -19% | $18.14 | 3,710 |
| Alaska | $52,430 | 15% | $25.21 | 1,080 |
| Arizona | $44,610 | 0% | $21.45 | 9,040 |
| Arkansas | $36,570 | -22% | $17.58 | 2,970 |
| California | $48,990 | 9% | $23.55 | 55,360 |
| Colorado | $46,350 | 4% | $22.28 | 7,100 |
| Connecticut | $48,260 | 7% | $23.20 | 3,560 |
| Delaware | $52,500 | 15% | $25.24 | 900 |
| Florida | $42,650 | -5% | $25.39 | 660 |
| Georgia | $41,160 | -9% | $20.51 | 22,670 |
| Hawaii | $39,590 | -13% | $19.79 | 10,900 |
| Idaho | $38,840 | -15% | $19.03 | 1,620 |
| Illinois | $41,290 | -8% | $18.68 | 2,820 |
| Indiana | $43,920 | -2% | $19.85 | 12,940 |
| Iowa | $45,650 | 2% | $21.11 | 6,950 |
| Kansas | $39,000 | -15% | $21.95 | 3,280 |
| Kentucky | $40,430 | -11% | $18.75 | 3,220 |
| Louisiana | $36,180 | -24% | $19.44 | 3,320 |
| Maine | $46,560 | 4% | $17.40 | 4,920 |
| Maryland | $45,060 | 1% | $22.38 | 1,230 |
| Massachusetts | $52,200 | 14% | $21.66 | 5,040 |
| Michigan | $42,040 | -6% | $25.10 | 9,650 |
| Minnesota | $58,890 | 24% | $20.21 | 11,390 |
| Mississippi | $36,960 | -21% | $28.31 | 5,890 |
| Missouri | $42,260 | -6% | $17.77 | 2,530 |
| Montana | $40,670 | -10% | $20.32 | 6,660 |
| Nebraska | $42,330 | -6% | $19.55 | 1,420 |
| Nevada | $41,240 | -8% | $20.35 | 2,240 |
| New Hampshire | $50,220 | 11% | $19.83 | 3,720 |
| New Jersey | $46,410 | 4% | $24.14 | 1,360 |
| New Mexico | $39,610 | -13% | $22.31 | 9,500 |
| New York | $47,880 | 7% | $19.04 | 2,040 |
| North Carolina | $45,650 | 2% | $23.02 | 19,040 |
| North Dakota | $51,370 | 13% | $21.95 | 11,990 |
| Ohio | $46,860 | 5% | $24.70 | 740 |
| Oklahoma | $40,770 | -10% | $22.53 | 11,460 |
| Oregon | $51,990 | 14% | $19.60 | 4,650 |
| Pennsylvania | $44,740 | 0% | $25.00 | 5,200 |
| Rhode Island | $44,340 | -1% | $21.51 | 10,890 |
| South Carolina | $43,070 | -4% | $21.32 | 800 |
| South Dakota | $43,790 | -2% | $20.71 | 4,820 |
| Tennessee | $40,990 | -9% | $21.05 | 1,010 |
| Texas | $39,170 | -14% | $19.71 | 6,760 |
| Utah | $37,080 | -21% | $18.83 | 32,360 |
| Vermont | $51,460 | 13% | $17.83 | 5,920 |
| Virginia | $44,980 | 1% | $24.74 | 610 |
| Washington | $50,430 | 11% | $21.63 | 8,110 |
| Washington DC | $52,820 | 15% | $24.24 | 11,290 |
| West Virginia | $37,510 | -19% | $18.04 | 1,440 |
| Wisconsin | $44,140 | -1% | $21.22 | 6,550 |
| Wyoming | $41,720 | -7% | $20.06 | 550 |
Top paying Metro / City areas for Dental Assistants
The table below illustrates the Metro areas and Cities where dental assistants earn the most – taking into consideration cost of living adjustments for each.
| City | Salary | Hourly Pay | Employment |
|---|---|---|---|
| San Francisco-Oakland-Hayward, CA | $62,830 | $30.21 | 5,550 |
| San Jose-Sunnyvale-Santa Clara, CA | $61,130 | $29.39 | 3,700 |
| Minneapolis-St. Paul-Bloomington, MN | $61,020 | $29.34 | 3,930 |
| Santa Rosa, CA | $56,750 | $27.28 | 680 |
| Rochester, MN | $56,510 | $27.17 | 350 |
| Mankato-North Mankato, MN | $55,470 | $26.67 | 110 |
| Santa Maria-Santa Barbara, CA | $54,850 | $26.37 | 530 |
| St. Cloud, MN | $54,710 | $26.30 | 240 |
| Bismarck, ND | $54,170 | $26.04 | 190 |
| Burlington-South Burlington, VA | $54,050 | $25.99 | 250 |
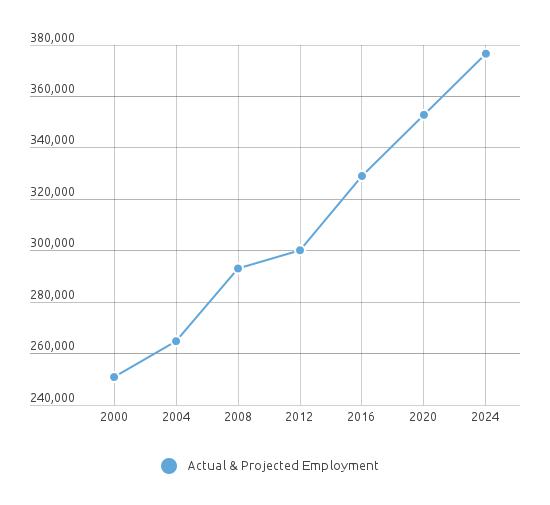
Dental Assistant Jobs Growth and Employment Projections
There has been a 31% increase in the employment of Dental Assistants since 2000 and this trend is set to continue. The Bureau of Labour Studies (BLS) predicts that demand for Dental Assistants will continue to grow between 2016 and 2024. In fact, it is predicted that a further 47,000 roles could be created in the sector in that time representing a 14% increase in employment figures.
Learn More:
Jump to your state:
- Alabama
- Alaska
- Arizona
- Arkansas
- California
- Colorado
- Connecticut
- Delaware
- Florida
- Georgia
- Hawaii
- Idaho
- Illinois
- Indiana
- Iowa
- Kansas
- Kentucky
- Louisiana
- Maine
- Maryland
- Massachusetts
- Michigan
- Minnesota
- Mississippi
- Missouri
- Montana
- Nebraska
- Nevada
- New Hampshire
- New Jersey
- New Mexico
- New York
- North Carolina
- North Dakota
- Ohio
- Oklahoma
- Oregon
- Pennsylvania
- Rhode Island
- South Carolina
- South Dakota
- Tennessee
- Texas
- Utah
- Vermont
- Virginia
- Washington
- Washington DC
- West Virginia
- Wisconsin
- Wyoming